Changing the Data Series of a graph
This procedure explains how to plot different data series on the x and y-axes of a graph. You cannot do this with any of LEGION’s built-in graphs: you must create a new customised graph. You can set data series by using available metrics and also by loading 'csv' data files from other graphs (see Loading a graph from a csv file ).
To change the Data Series of a graph:
- Follow the steps in Creating a new custom graph .
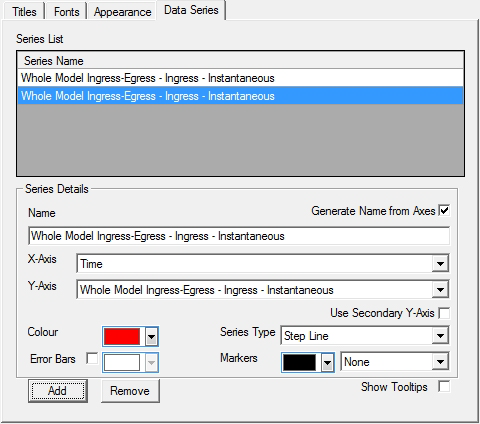
- Click on the 'Data Series' tab.
-
To add Data Series, click the
Add button one or more times.
This adds one or more entries to the 'Series List' and makes certain associated fields available and active.
- To set the parameters of a data series, first click on it in the Series List to highlight it.
- If you would like the name of the data series to match the data on the axes, check the box labelled 'Generate name from axes'. If you would like to name the series something else, uncheck the box and type a different name into the 'Name' field.
- Select a metric from the 'X-Axis' drop-down list ('Time' is usually the appropriate choice).
- Select a metric from the 'Y-Axis' drop-down list.
- If you want to plot data using the secondary y-axis, check the box labelled 'Use Secondary Y-Axis'.
- Select a 'Colour' for this data series to be plotted in.
- Select a 'Series Type' for this data series (Step Line, Column, Bar).
- If you wish to display 'Error Bars', check the associated box. Error bars are used on graphs to indicate the full range of data from which each averaged plotted point is calculated.
- Select a colour for the error bars from the adjacent drop-down list.
- For the graph's plot markers, select a style from the drop-down list labelled 'Markers' (None, Square, Star).
- Select a colour for the markers from the adjacent drop-down list.
- If you would like to be able to hover your cursor over a line in the graph to see the value at that point, check the 'Show Tooltips' box (this may slow down performance).
- Click Apply to save your changes.
- Repeat from step 4 for any further data series.
- Click OK to close the dialog.